
by William McCallum
Newspapers are full of graphs, far more than 10 or 20 years ago. Indeed, I have a graph to show that!
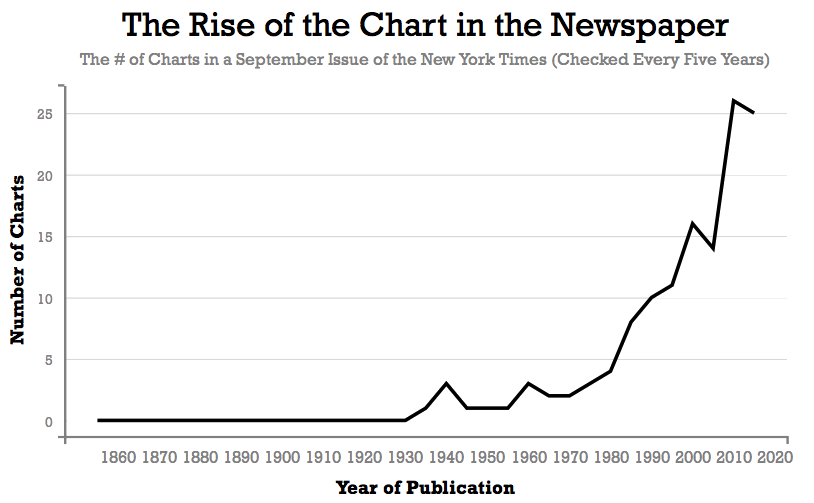
And yet I wonder how often readers see graphs as pictures illustrating a point, rather than as texts to be read. A reader looking at the graph above might say “Wow, that’s a big increase!” But will they notice that the number has almost doubled since 2000? That it was 0 until 1930? Every element of this graph deserves attention: the scale on the axes, the labels on the axes, the title and subtitle, and yes, the actual line that forms the graph itself. But that line is meaningless by itself. Reading this graph requires the coordinated interpretation of many elements.
A Coherent Progression of Learning
The IM K–12 Math curriculum offers a coherent progression of learning to help students develop this sophisticated skill, starting in grade 5 where students first start plotting points in the first quadrant of the coordinate plane, and continuing all the way to high school.
Grade 5: Interpreting Data Points
For example, in grade 5, students see this graph showing how many times Han and Jada got heads and tails when they flipped a coin several times.
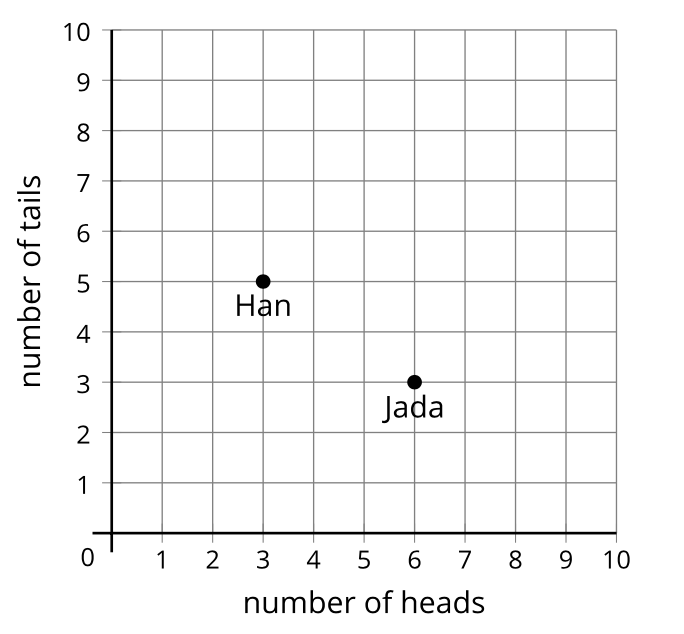
Students are asked how many heads and tails Jada and Han got, then repeatedly flip a coin for themselves and plot the resulting points.
Grade 8: From Coordinate Grids to Scatter Plots
One of the advantages of a coherent curriculum is that you can start each lesson with an understanding of where students are in a progression of ideas. Many of the lessons start with a warm-up designed to activate that prior learning.
A good example of that is the warm-up in this lesson from grade 8 about what a point in a scatter plot means, at the beginning of the unit about associations in data (Grade 8, Unit 6, Lesson 3). The warm-up asks students to interpret a data point that represents the age in months and weight in kilograms of a giant panda. The skill required for this activity is one that students first encountered in grade 5, but the complexity has increased through grades 6, 7, and 8. In comparison with grade 5 work, by this point the numbers are larger, the context is more complex, and gridlines aren’t always expected.

The purpose of this activity is to get students to cast their eyes from the point to each axis to interpret the meaning of the point. The axes, with their scales, labels, and units, are prominent actors in this activity. Students have to look at the numbers on the axes and connect them to the point to interpret it correctly. In later lessons that skill will be used as they look at scatter plots with multiple data points and interpret trends in data.
Grade 8: Analyzing Graphs to Learn About Context
Another example of an activity that builds on prior learning is the second activity in this lesson (Grade 8, Unit 5, Lesson 5).
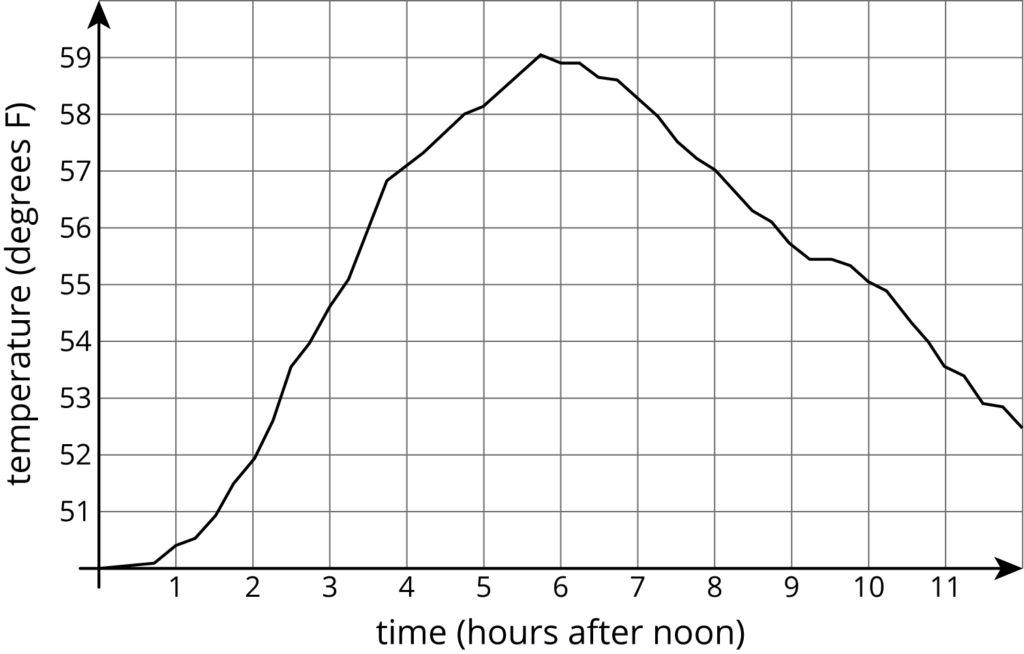
Here students are asked various questions about the contexts, such as whether it was warmer at 3:00 pm or 9:00 pm. The activity builds on a multi-year learning progression with many opportunities to connect graphical representations to concrete situations. Often these concrete situations are ones that are familiar to students, such as running around a track, in order to facilitate making the connection. Early in the progression, students might start with such a context and represent it with a graph.
However, by this point in grade 8, the standards require students to “describe the functional relationship between two quantities by analyzing a graph” (8.F.B.5). Notice the difference here. Rather than going from a familiar context to a graph, students work on starting with a graph, as in this activity, and analyze it to learn about a context, possibly an unfamiliar one. Learning to answer questions about a wide array of quantities in context prepares them to learn about the complexity of the world around them through understanding and interpreting graphs.
Algebra 2: Interpreting Graphs that Represent Exponential Equations
Thus the progression, moving from concrete to abstract, opens a pathway into a rich universe of contexts in the human experience, including things like temperature, flavor, viscosity, and weight, among many others. As a final example, consider the second activity from this lesson in Algebra 2 (Unit 4, Lesson 16) about the growth in population of two colonies of bacteria, measured by the area of the colony.
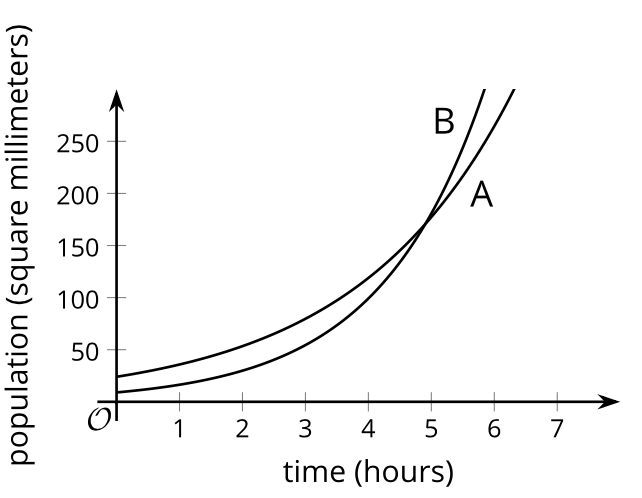
Students are given explicit formulas for the two exponential functions, f and g, and represented by graphs A and B, shown. Then they are asked to connect the meaning of the intersection point of the two graphs with the solution of the equation f(h) = g(h). In the coursework between grade 8 and Algebra 2, another level of sophistication has been developed in their graph reading skills; students now coordinate their interpretation of graphs with equations involving the variables represented on the axes.
In a tightly designed, coherent curriculum like IM K–12 Math, the structure of progressions is not visible at the grain size of a lesson. You have to look across lessons, even across grade levels, to see the accumulation of skills and understandings into a coherent package of knowledge that will stand students in good stead for a lifetime of learning and exploration.
Next Steps
Take a look at these graphs, which come from activity 3 in this lesson (Grade 8, Unit 5, Lesson 5). The first one shows the amount of garbage produced in the US each year between 1991 and 2013, and the second shows the percentage of garbage recycled during the same period.
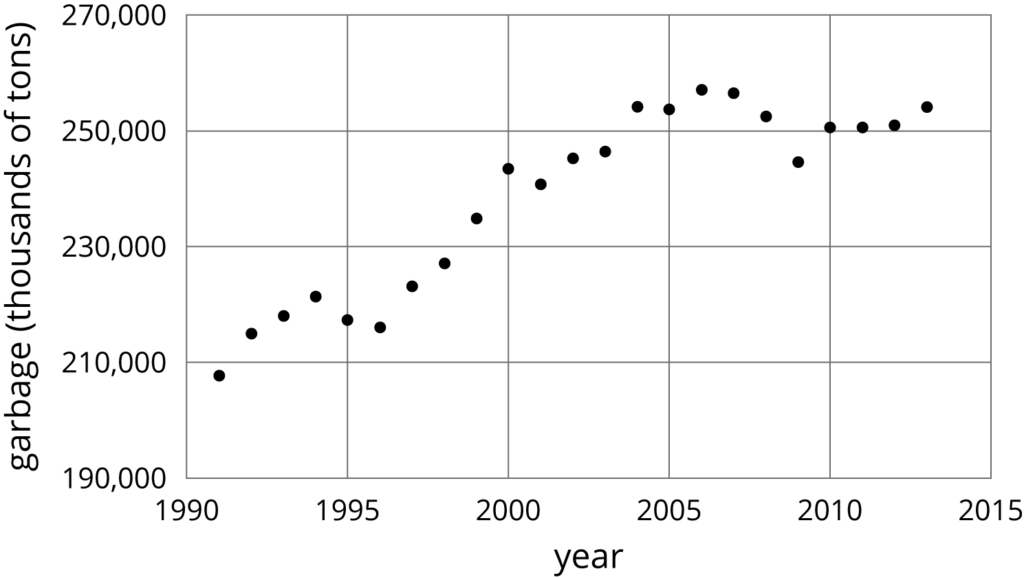
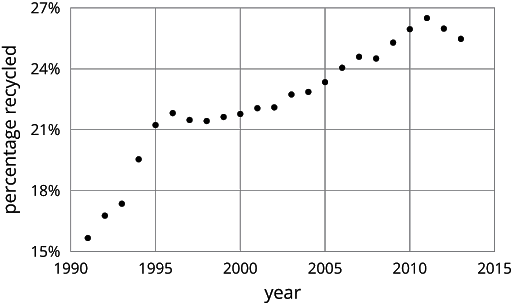
By approximately what factor did the amount of garbage produced increase between 1991 and 2008? By approximately what factor did the percentage of garbage recycled increase between 1993 and 2006? To which features of the graph do you have to pay attention to answer these questions?