By Jenna Laib and Kristin Gray
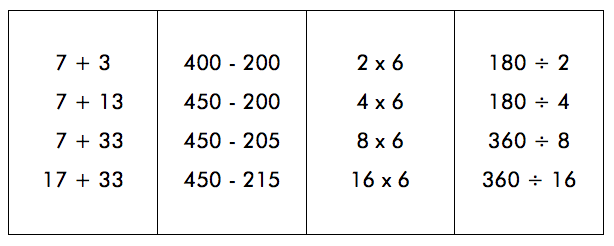
Take a moment to think about the value of each expression below.
$\frac{1}{4}\times \frac{1}{3}$
$\frac{1}{4}\times \frac{2}{3}$
$\frac{2}{4}\times \frac{2}{3}$
$\frac{3}{4}\times \frac{2}{3}$
What do you notice? How would you explain the things you notice?
If you are like us, or the students in Ms. Stark’s grade 5 classroom, you may have noticed many things. Things such as each expression has the same denominator, or the way in which the values increased as the problems progressed. When students notice these things, we often ask, ‘Why is that happening?” but it can be challenging to explain why beyond the procedure one followed.
But fifth graders are brilliant.
Grade 5 teacher Francesca Stark wrote an enthusiastic email after doing this number talk from IM K–5 Math with her students.
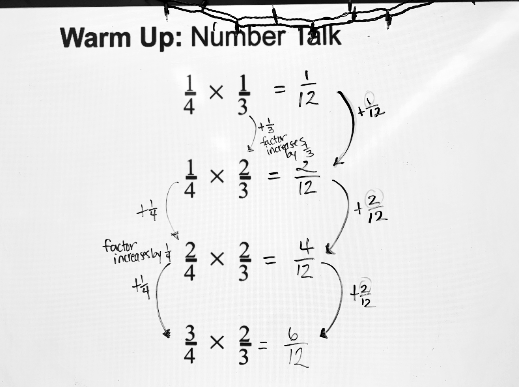
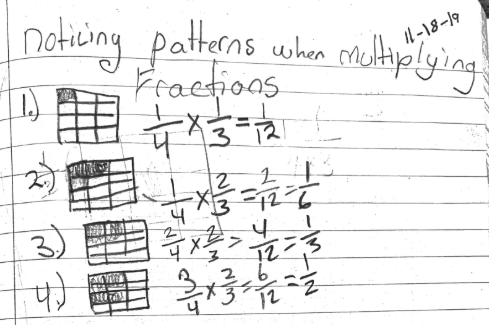
“We were interrupted by the fire drill,” she wrote. “But students were looking at the patterns of the products: $\frac{1}{12}$, $\frac{2}{12}$, $\frac{4}{12}$, $\frac{6}{12}$.” They wondered, “why an increase of $\frac{1}{4}$ in the first factor of the last three problems made the product go up by $\frac{2}{12}$, but an increase of $\frac{1}{3}$ in the second factor of the first and second problem only made the product increase by $\frac{1}{12}$ .” She was thinking about ways to support students in discovering why this was happening.
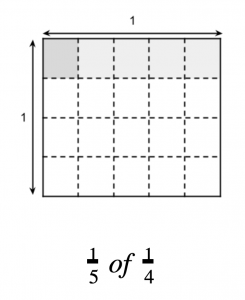
This Number Talk comes after a series of lessons focusing on conceptual experiences with multiplying fractions. In prior lessons, students have found a fraction of a fraction, for example, “there was $\frac{1}{4}$ of a pan of cornbread remaining, and Priya ate $\frac{1}{5}$ of it.” and used diagrams to solve and represent their thinking.
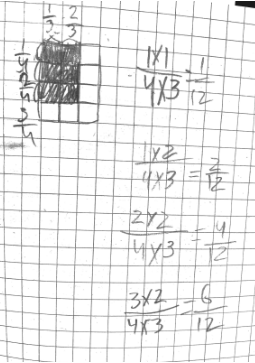
Students developed their understanding as they noticed the denominators multiplied to find the number of small rectangles in a unit square and the numerators multiplied to find the number of shaded pieces.

These ideas were all built with a consistent representation: the area diagram. So when the fifth graders wanted to explore the why behind what they observed in the products of the number talk, they had a common visual language to use.
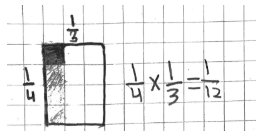
Students started by representing the first problem in the string, $\frac{1}{4}\times \frac{1}{3}$ . Every student adeptly represented the product with a rectangle partitioned into fourths and thirds and shaded in a single small rectangle— $\frac{1}{12}$ of the whole—to represent the product.
Next, students were asked to represent the other three problems. Some students decided to show each problem on a separate diagram, which allowed us to look for the difference between the four representations. Other students chose to show all four problems on a single diagram, using labels or colors to indicate the change from problem to problem.
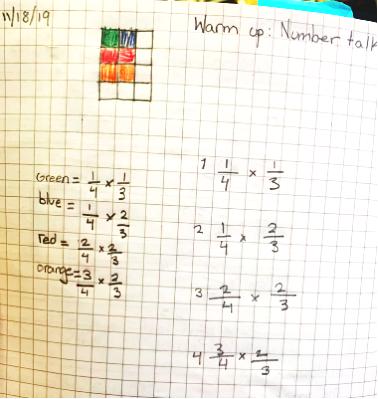
This student decided to show her work on a single diagram. She modeled the first problem— $\frac{1}{4}\times \frac{1}{3}=\frac{1}{12}$ —in green, and added on the additional $\frac{1}{12}$ piece in blue to show how the diagram would need to change to show the second problem, $\frac{1}{4}\times \frac{2}{3}$. “Then, to change it to show $\frac{2}{4}\times \frac{2}{3}$, you’re only adding a fourth, but now each fourth has two pieces colored in, not one.” When pressed to explain further, she added, “I guess because it went up to $\frac{2}{3}$ , so it’s 2 pieces out of 3 colored in every time.”
“For thirds, I shade another column. For fourths, I shade another row,” this student explained. “After the second problem, there’s two in a row, so that’s $\frac{2}{12}$ .”
“I did the same thing,” another student said. “I kept adding rows with two across. If there were only 1 across it would be adding $\frac{1}{12}$ , but there’s 2 for the $\frac{2}{3}$ , so it’s $\frac{2}{12}$ .”
The IM K–5 Math curriculum purposefully makes use of mathematical representations as a way for students to develop an understanding of concepts and procedures. In this particular case, the area diagram supported students in their reasoning and communication about how the change in factors impacted the products as they multiplied fractions. Students took ownership of this mathematical representation to push their thinking in new directions.
All of these students are still wrestling with the underlying mathematics, and figuring out how to communicate ideas clearly. The diagram supports this work. It gives them a starting place, and allows them to leverage the diagram as a way to think about the mathematics, in addition to a way to do the computation.
Next Steps
Choose one of the Number Talks to try in your classroom. When you are finished, record the patterns students notice in the problems and responses. Ask them why those patterns are happening and capture the ways in which they support their reasoning. What representations do they use and how do they show their brilliance?