
By Maureen D. O’Connell, Math Specialist
Some math tools and representations help students solve in-the-moment problems. Other math tools and representations help students solve problems and grow their conceptual understanding.
Which type of representations are you choosing for your students?
True confession: For most of my 17 years as a primary classroom teacher I guided students to use the 100 charts conveniently located on the inside cover of their student workbooks. Later, as a math specialist, I ordered these grids laminated—and in bulk. After teaching IM K–5 Math for the past two years and 25 years of teaching, I can confidently report that I am a reformed hundreds chart dealer.
My transformation stemmed from observations in a grade 2 classroom that was participating in the IM K–5 Math alpha pilot, pre-COVID. Students were solving comparison problems as part of Unit 1: Adding, Subtracting, and Working with Data.
100 charts—10 x 10 grids representing the numbers 1 to 100—can be used in myriad ways. Many teachers use 100 charts to practice counting. Students follow along with the numbers on the chart as they count. In theory, students start to connect the number name to the numerals that represent that number. Soon this chart becomes a tool for solving addition and subtraction tasks. Many teachers, including my former self, hope that an understanding of how our number system works will grow with their regular use.
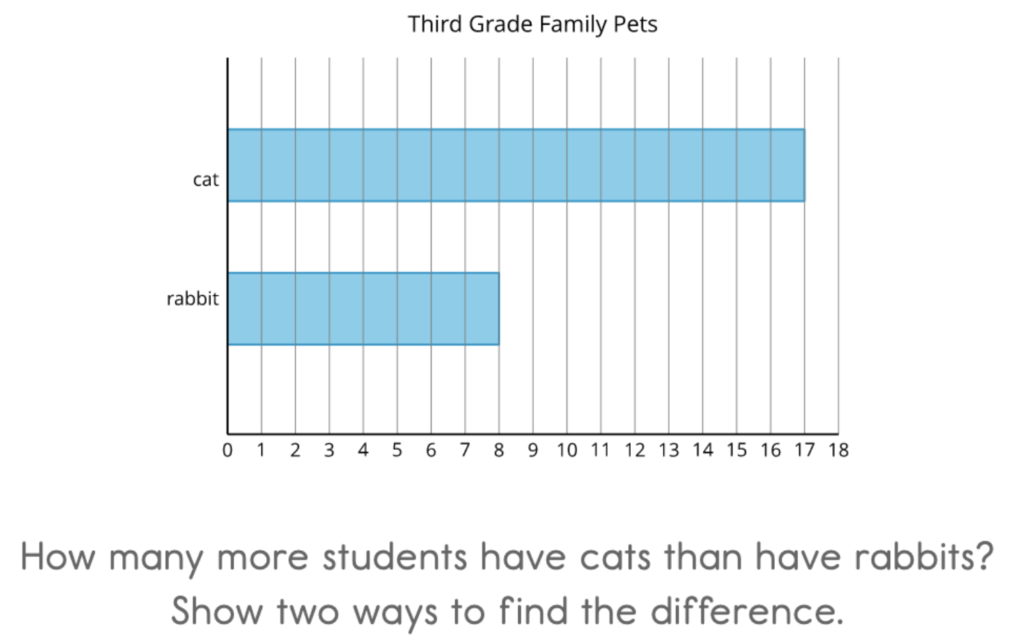
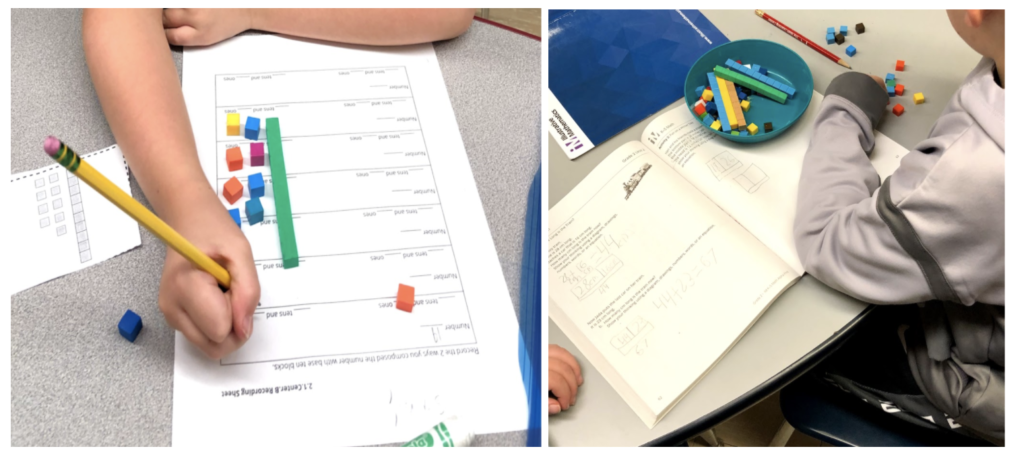
Most of my students used the bar graph representation to count the spaces from rabbit to cat to find the difference. Some used connecting cubes or counters. They made a tower of 10 linking cubes and 7 more to show the number of cats. Then they broke off 8 cubes to represent the number of rabbits.
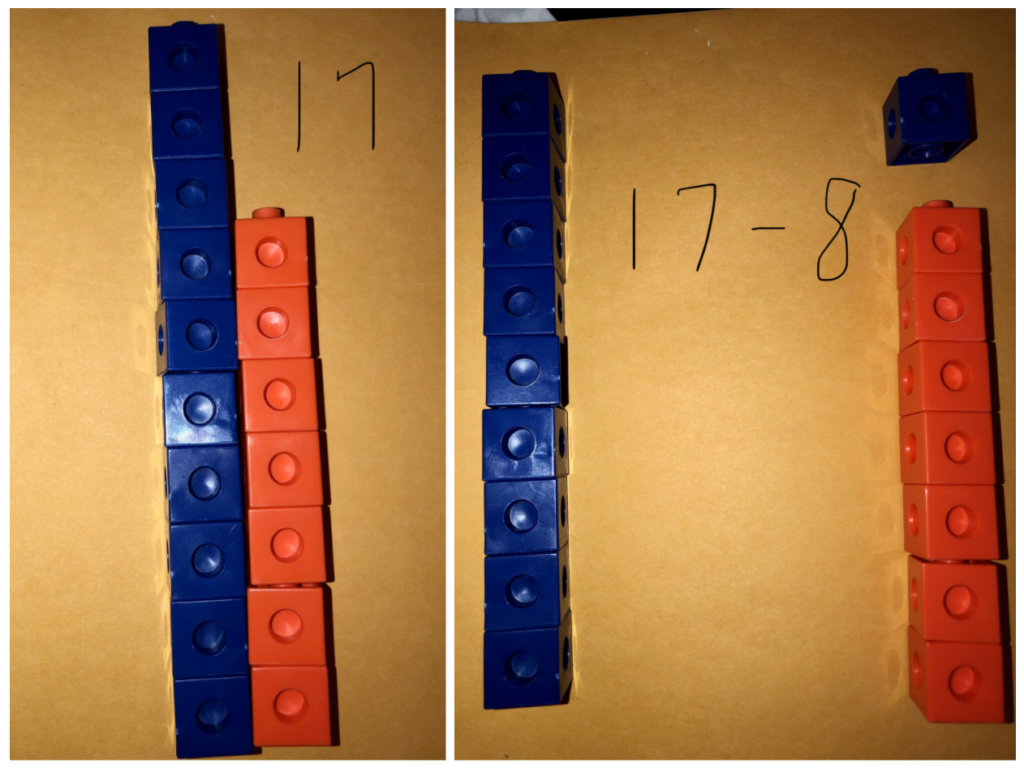
I noticed that they first removed the loose 7 and then took one from the ten rod to make the 8 rabbits. They saw the difference was 9. There were 9 more cats than rabbits.
Several of my former grade 1 intervention students were in the class. These brand new second graders looked panicked as they searched our materials shelves for 100 charts without luck. I had taken them out of circulation based on IM’s recommended representations and tools for the year. Out of sympathy, I retrieved some 100 charts for these students to use for adding and subtracting. As they worked with them I noticed each student was married to counting by ones on the grid rather than using more efficient strategies. They often missed a count, or double counted, or skipped a row as they moved to a new decade counting by ones. The hundreds charts were generally inefficient when working with larger numbers. In a rookie move, I tried to show them how they could hop down rows to count tens, but this did not fit their conceptual understanding of numbers or how our base 10 system operates. So: we put the 100 charts back in the closet.
Finding themselves 100 chart-less in grade 2, these students needed other ways to solve problems. Thanks to IM K–5 Math’s problem-based lesson structure, math class was centered on students sharing their thinking and strategies. These floundering students heard and saw how their classmates thought about these tasks. Classmates modeled how they visualized the problem and how their representation matched their thinking. This discourse made student thinking visible and created a rich fund of models and strategies for all students.
IM K–5 Math helped these students focus on understanding what was being asked before solving. Hearing classmates explain exactly how they had used connecting cubes or the graph to solve the problem served both as inspiration and rehearsal for this 100-chart-loving group. It broke them from their number chart dependency. It created sense makers.
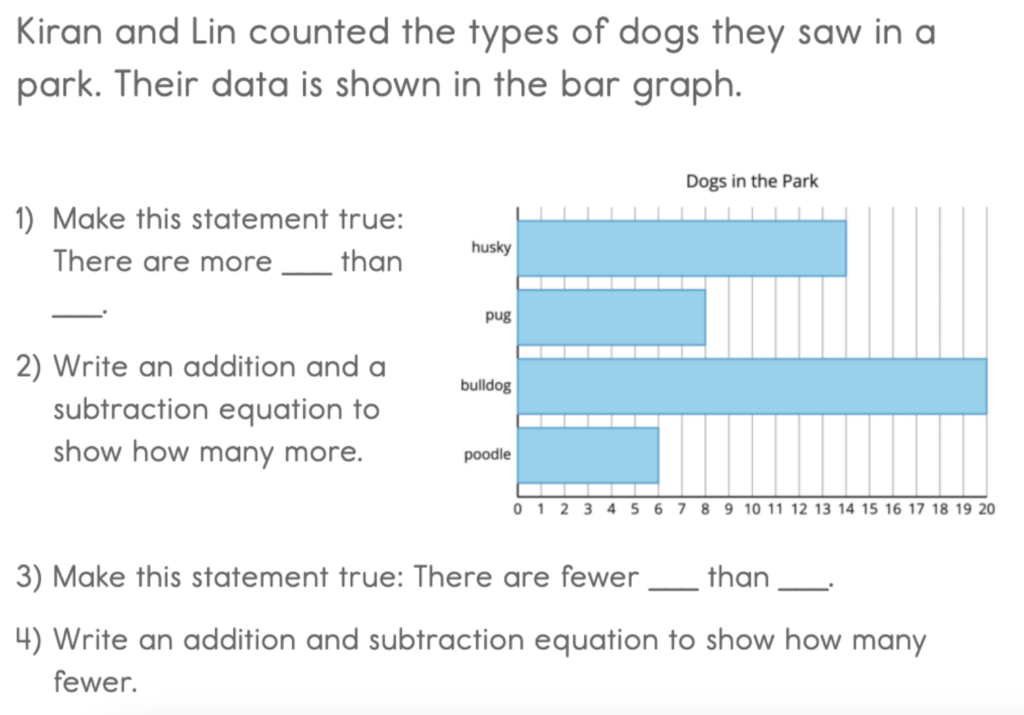
Later, I watched these students write questions based on the data represented and ask others to solve them. They used the graph bars or built towers of connecting cubes to represent the task and saw the difference in length as their solution. “There are 12 more bulldogs than pugs. 20 – 8 = 12 and 8 + 12 = 20” They drew a box around the number that showed the information they had determined.

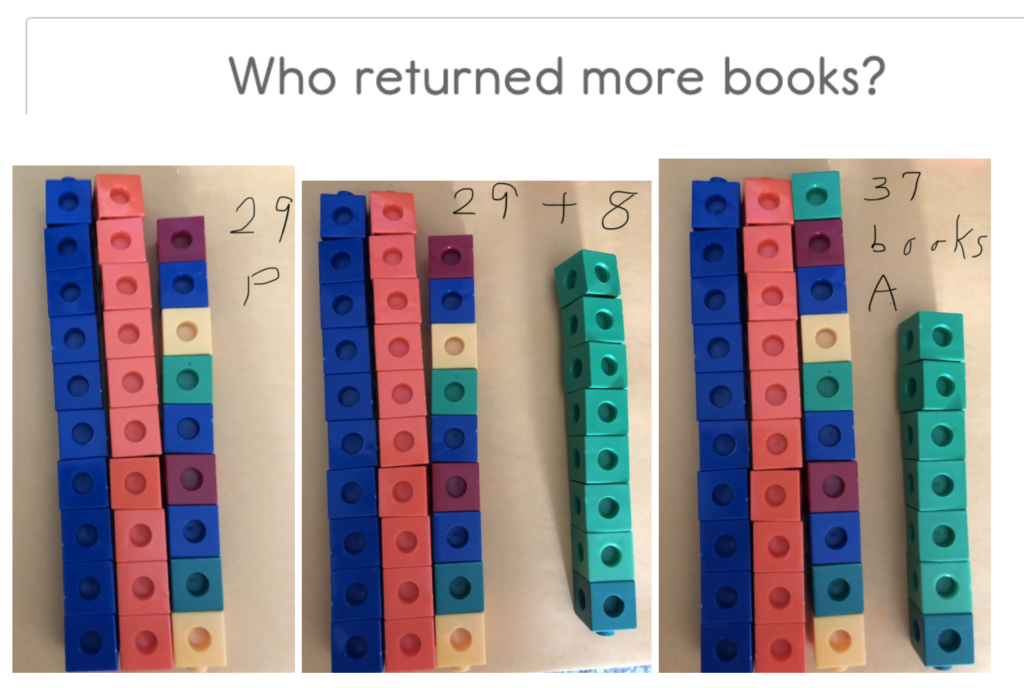
“Andre returned more books.”
Some students used towers of tens and loose ones made from connecting cubes to represent tens and ones in two digit numbers and composed by adding to create new groups of ten and ones. Later they explored using expanded form to add and subtract two-digit numbers. They developed an understanding of unitizing that they had not formed in grade 1. As students used representations that supported an understanding of place value and unitizing, I saw their conceptual understanding grow.
Later they transitioned to base-ten blocks and learned to compose and decompose numbers and use tens and ones given addition and subtraction problems within 100.
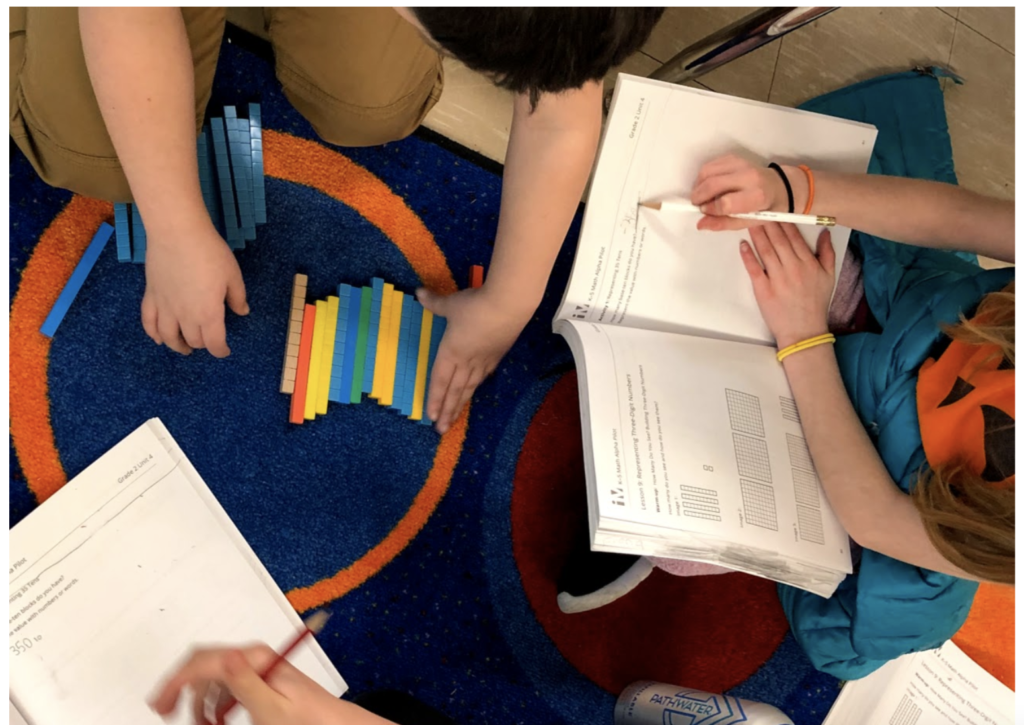
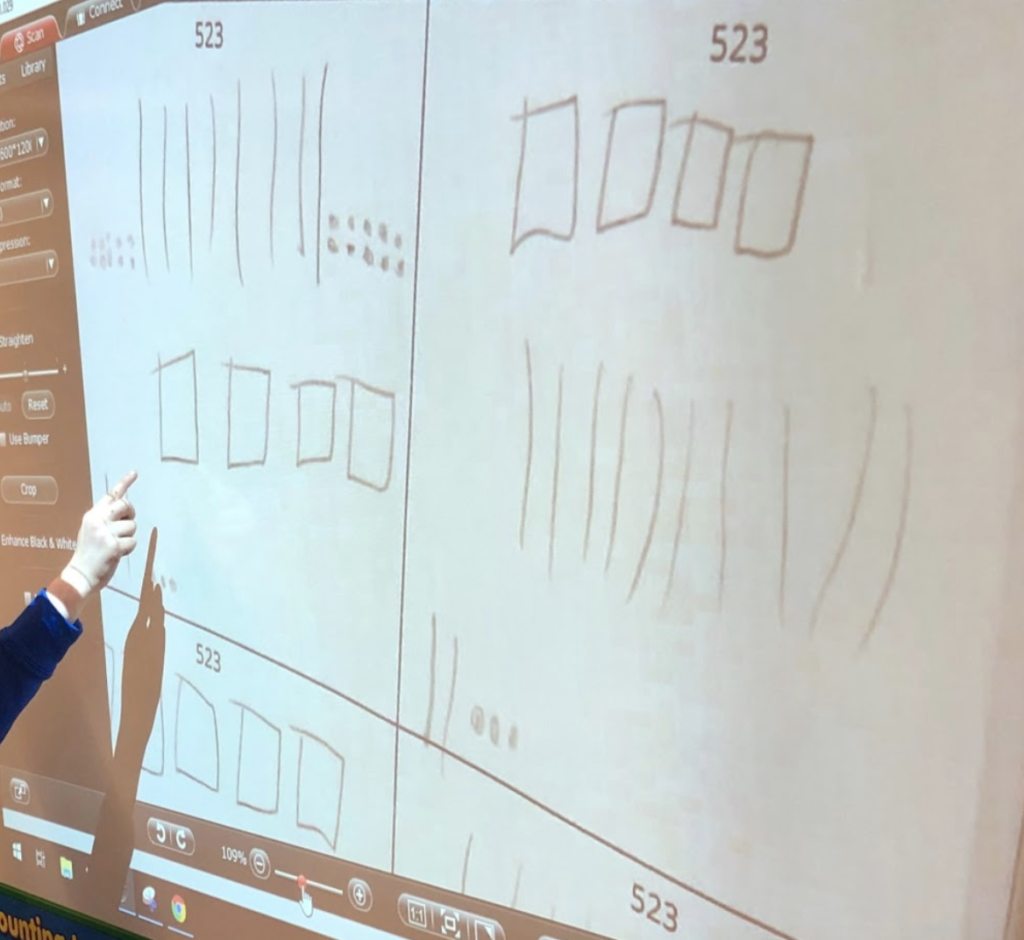
They used their understanding of tens and ones to incorporate a new unit: hundreds. They represented three digit numbers flexibly.
I reflected on what I had witnessed. My students were growing in understanding operations without a 100 chart. The structures we did use helped me see what students understood, and determine next steps. As students felt welcomed into the math, they took risks, and productively struggled as they made their thinking visible. They developed positive math identities and saw themselves as capable doers and learners of mathematics. They developed flexible strategies with operations that demonstrated an understanding of place value.
I realize that 100 charts serve many purposes, for example students might notice and wonder about number patterns or patterns in number word sequences. But I definitely understand why IM did not choose this as a representation for operations. In this area the 100 chart is a tool that only meets one of the two tests for representations.
“Does this representation/tool help students solve problems?” Yes.
“Does it also help students grow their flexible computation based on an understanding of place value?” No.
Used in isolation it does not grow understanding of our base-ten system or help students understand units such as ones, tens, and hundreds.
Using the 100s chart for addition and subtraction really seemed to restrict my students to a world of ones. It did not support their understanding of place value or develop their ability to unitize.
As I explored IM’s thinking about representations, I found this sage advice in the IM K–5 Math curriculum guide.
“One challenge for students in learning mathematics is the ambiguity and incoherent use of mathematical language in relation to representations. Having more representations is not necessarily better and can interfere with coherence.”
According to Jerome Bruner, “The power of a representation can . . . be described as its capacity, in the hands of a learner, to connect matters that, on the surface, seem quite separate. This is especially crucial in mathematics” (Bruner, 1966).
The 100s chart was not helping students make important connections about place value or recognizing new units such as tens.
The IM K–5 Math curriculum guide further states: “mathematical representations can be used for two main purposes: to help students develop an understanding of mathematical concepts and procedures or to help them solve problems. The IM K–5 Math materials make thoughtful use of representations in both ways.
Curriculum representations and the grade levels at which they are used are determined by their usefulness for particular mathematical learning goals. Across lessons and units, students are systematically introduced to representations and encouraged to use representations that make sense to them. As their learning progresses, students are given opportunities to make connections between different representations and the concepts and procedures they represent. Over time, they will see and understand more efficient methods of representing and solving problems, which support the development of procedural fluency.” IM K–5 Math Curriculum Guide
As I researched further I learned that some of the selected tools and representations, like the tape diagram, are also powerful because they are used well into middle school. Some are introduced in a later grade compared to other curricula for developmental and mathematical reasons.
With this powerful learning experience in mind, I carefully followed the sequence of representations as I taught grades K–5 last year during remote learning. Even across the screen, these thoughtful representations supported students in developing such solid understandings of units and place value that we never missed the 100s chart as a computation tool. I would love to hear your experiences with the sequence and choices of representations used in IM K–5 Math.
Next Steps
I invite you to reflect on the tools and representations most used in your classroom and ask the question, “Does this tool or representation help students solve problems while building conceptual understanding?” If you find they do not, consider reading more about the representations chosen for IM K–5 Math in the IM K–5 Math curriculum guide.
