
By David Petersen, 6–12 Curriculum Specialist and
Ashli Black, Director, 6–12 Curriculum
The Algebra 1 course in IM 9–12 Math™ begins with a unit on one-variable statistics, a choice that many find surprising. Why start with statistics? And where does it go from there? As in all IM courses, the arrangement of units in Algebra 1 is informed both by a progression of mathematical ideas and by key principles on mathematics teaching and learning. The topics in IM Algebra 1 are ordered in an intentional way: to tell a story that efficiently introduces students to high school mathematics.
This post looks at the mathematical story through the first four units, starting with one-variable statistics, followed by a look at linear equations, inequalities, and systems, then two-variable statistics, and a unit on functions. It alternates between messy, real-world problems that require statistical tools and more straightforward relationships that can be described by linear equations while increasing from one- to two-dimensional representations.
Unit 1: One-variable Statistics
The course begins with a look at quantities in context, building on understandings about data analysis developed in earlier grades. Students began gathering, representing, and analyzing data in elementary school. For example, the question, “How long is this pencil?” (from the Grade 3 materials) is useful for learning about fractions and using tools, but is not particularly interesting algebraically.
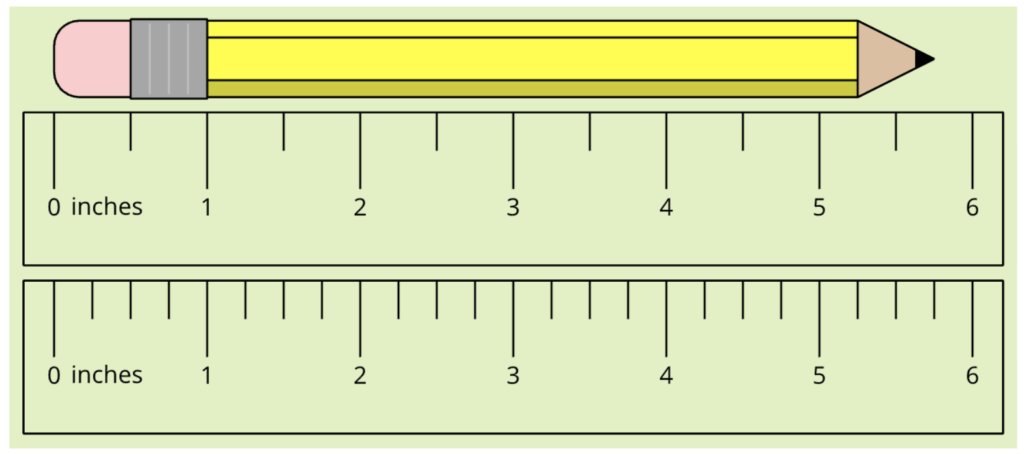
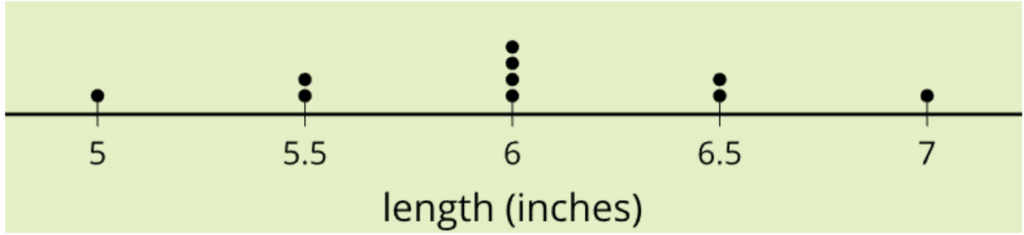
The first unit of Algebra 1 builds on this number sense by considering a single quantity with some variability. Using statistical tools that they began developing in middle school, students collect one-dimensional data and analyze what might be typical of the data. They find a measure of center and look at measures of variability to see how widely spaced the data is around that typical value.
For example, in a practice problem from Algebra 1 Lesson 3 we ask, “What is the typical length of pencils used by students in a class?”
Unit 2: Linear Equations, Inequalities, and Systems
In the second unit, students expand their analysis to numbers that are paired in two dimensions. For example, the relationship between the amount of almonds and dried figs that can be purchased under budget constraints is explored in Unit 2 Lesson 5.
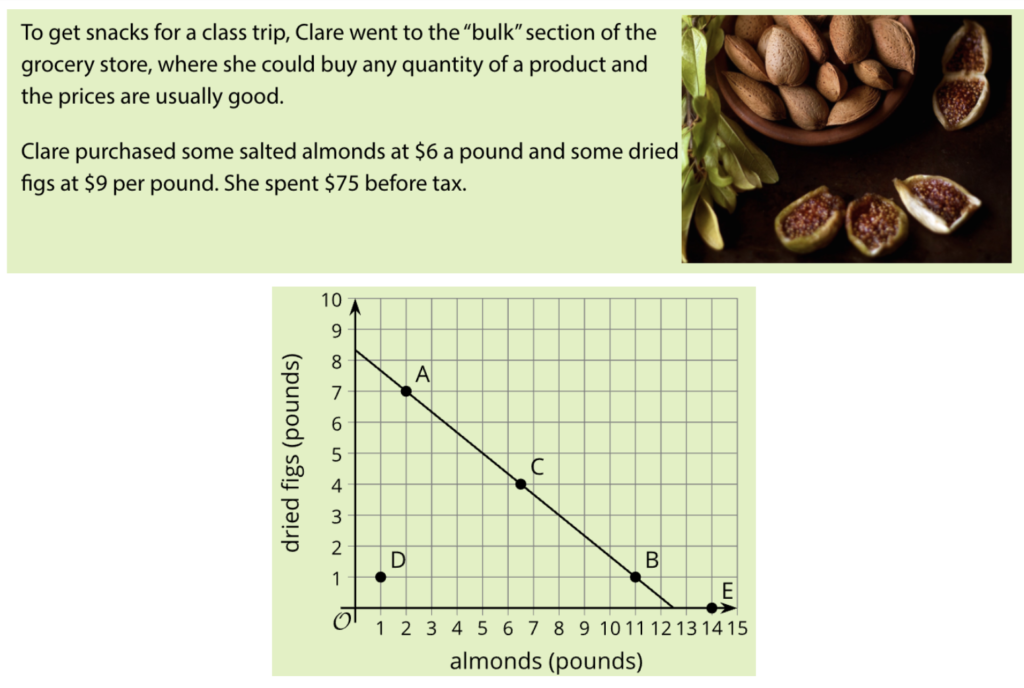
When graphed, the line is a visual representation of the set of paired numbers—pounds of salted almonds and pounds of dried figs—that satisfy the budget constraint. Later in the unit, students build on this thinking as they consider having two constraints to work with, leading to the study of systems of equations. Throughout the unit, they examine the relationship between points and lines in two dimensions using carefully selected contexts in which values follow strict linear rules.
Unit 3: Two-variable Statistics
Similar to how Unit 1 added variability to measurements, Unit 3 acknowledges that real-world values often include some variability from strict linear rules. Here, students examine some statistical methods to model real-world situations with linear relationships. For example, instead of looking at a single quantity, students examine a linear model for the relationship between sale price of food items and their ingredient cost (Unit 3, Lesson 4).
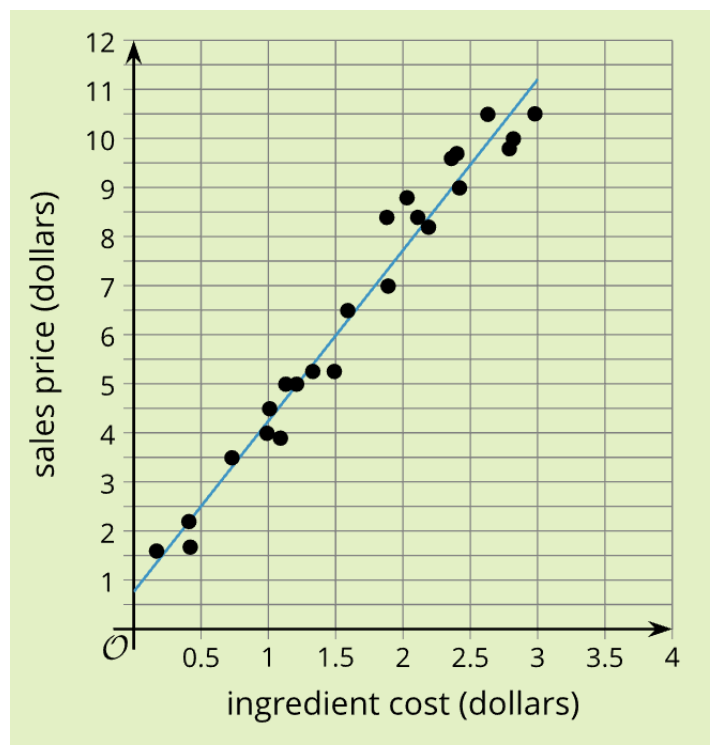
Just as students learned to use the mean to find what is typical for a one-dimensional data set and standard deviation to measure variability, they can use a line of best fit to mathematically model a two-dimensional data set and the correlation coefficient to measure variability. This work brings together algebraic and statistical knowledge and gives students another avenue to make sense of the relationships between linear contexts, graphs, and equations. For example, they interpret the slopes of linear models in the context of the data.
Unit 4: Functions
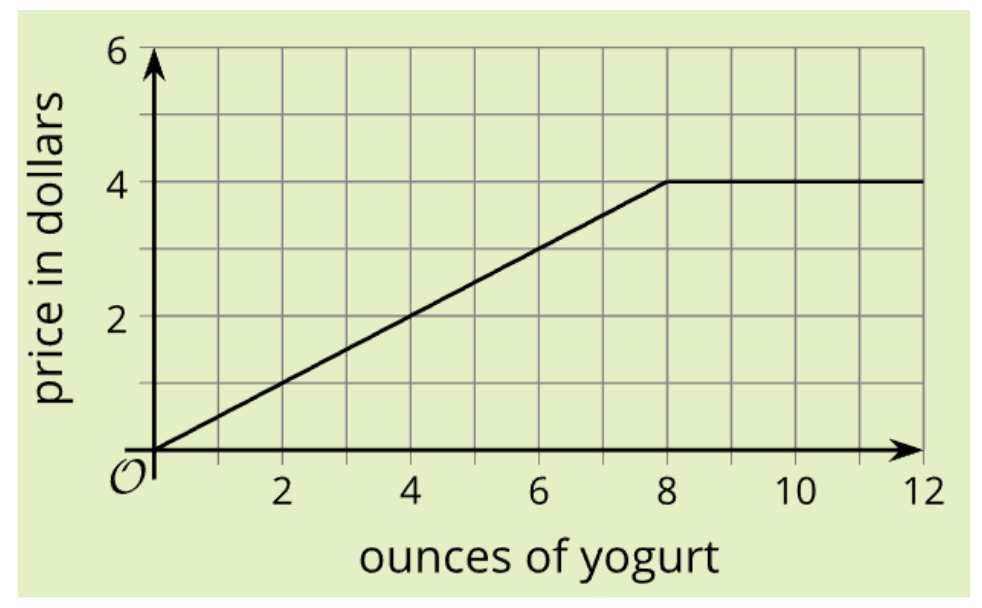
Continuing the pattern of alternating between statistical explorations and stricter algebraic relationships, Unit 4 invites students to look at functions as rules that describe the relationship between two variables. The unit begins the transition from linear situations towards the nonlinear work that makes up the latter half of the course. This is an example of a piecewise graph that can be found in Unit 4, Lesson 12 that shows the relationship between the weight of frozen yogurt and its price changing after it reaches a threshold.
Units 5–7: Exponential and Quadratic Functions
In the last three units of the course, students go on to explore other nonlinear functions and equations such as exponential and quadratic relationships. Lessons focus on understanding and manipulating the strict mathematical relationships with opportunities to mathematically model more messy, real-world situations using the statistical ideas established in the earlier story using modeling prompts. For example, in the modeling prompt Critically Examining the National Debt, students research data and make decisions about the type of function to use to model their data.
The Story of Algebra 1
The opening story of Algebra 1 is one of relationships, modeling, and dimension. While it is tempting to rearrange units to “get to the good stuff” or to follow mathematical progressions used in previous years, the story in IM 9–12 Math is designed with intentionality and coherence.
Next Steps
*In addition to the mathematical content, the first few units carefully build the classroom community through establishing norms and using equitable practices. Check out the posts linked in the first paragraph for more.
- Equitable Teaching Practices in IM K–12 Math, by Tina Cardone
- Co-Creating Classroom Norms with Students, by Anna Polsgrove, Brooke Braga, and Marcela Aguila
*In addition to building up mathematical content knowledge, how do the first units of Algebra 1 support establishing norms for a problem-based classroom?
*To learn more about how students perceive problem-based learning, check out this blog post by Max Ray-Riek.
