
By Ashli Black and Elisa Smith
Grade 8 is a year marked by shifts in mathematical focus. Where grades 6 and 7 introduce students to negative numbers and using them in operations, grade 8 introduces them to irrational numbers and using them with the Pythagorean Theorem. Where grades 6 and 7 dig into one-variable statistics, grade 8 begins the work with two-variable statistics. And where grades 6 and 7 emphasize ratios and proportional relationships, grade 8 turns its attention toward functions, particularly linear ones. For this last shift, the question becomes how do you go from a foundation in proportional relationships to an understanding of all types of linear relationships? Well, you start with geometry.
The Geometry of Lines
So let’s focus on lines for a bit from a geometric perspective. A line drawn on the coordinate plane has features students can use to describe it, including its slope. From left to right what’s going on with that line? Can that change be quantified? Students using IM 6–8 Math are positioned to examine these questions critically by starting the year with congruence and similarity. The study of similar triangles—slope triangles—builds foundational ideas about slope.
(https://curriculum.illustrativemathematics.org/MS/teachers/3/2/10/index.html)
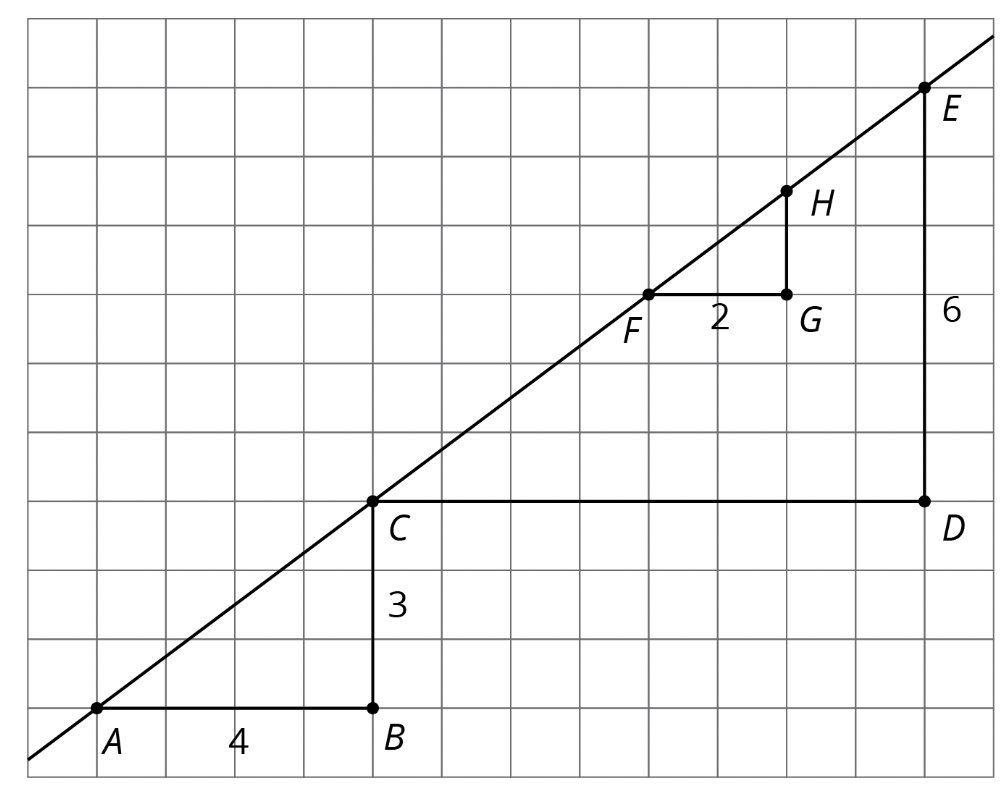
For the diagonal line shown here, if one student picks two points and makes a slope triangle and another picks two points and makes a slope triangle, they will end up with similar triangles. How do they know they are similar? Well, they can pull from earlier thinking, developed in Unit 1 and the first half of Unit 2, and use a sequence of rigid transformations and a dilation. Or they can say that since the triangles have two pairs of congruent angles then they must be similar. Regardless of how students determine the similarity of the triangles, they can conclude that the vertical length divided by the horizontal length for any slope triangle of a line has the same value and this value is a way to quantify the slope of the line. (And by doing the vertical divided by the horizontal they get a number that gets greater for steeper looking lines, which is nice.)
Once a method for calculating the slope of a line is established, students gain a way to write an equation for the line based on this calculation.
(https://curriculum.illustrativemathematics.org/MS/teachers/3/2/11/preparation.html)
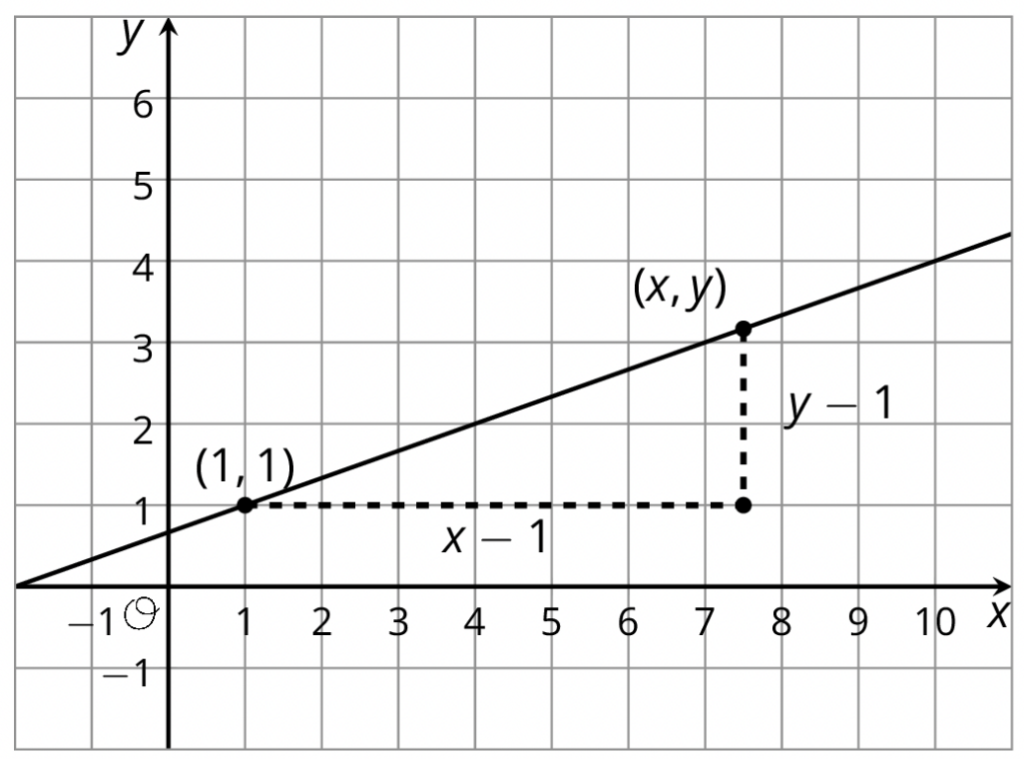
The slope of the line shown here is $\frac{1}{3}$. Since the slope between any two points on the line is the same, we can also say that for the points $(1,1)$ and $(x,y)$ the value of vertical length, $y-1$, divided by the horizontal length, $x-1$, must equal $\frac{1}{3}$. That is, $\frac{y-1}{x-1}=\frac{1}{3}$. From quotients of side lengths of similar triangles, we can make an equation and use it as a point-tester. If a point makes the equation true, it must be on the line.
All of this means that students start Unit 3: Linear Relationships with a robust geometric understanding of the slope of a line built from the work with slope triangles. But not all the pieces are there yet to be able to generalize to all linear relationships: slope has only been positive thus far, and linear relationships have only been proportional. Connections between rate of change, slope, and the constant of proportionality still need to be made.
From Ladybugs and Ants to Stacking Cups
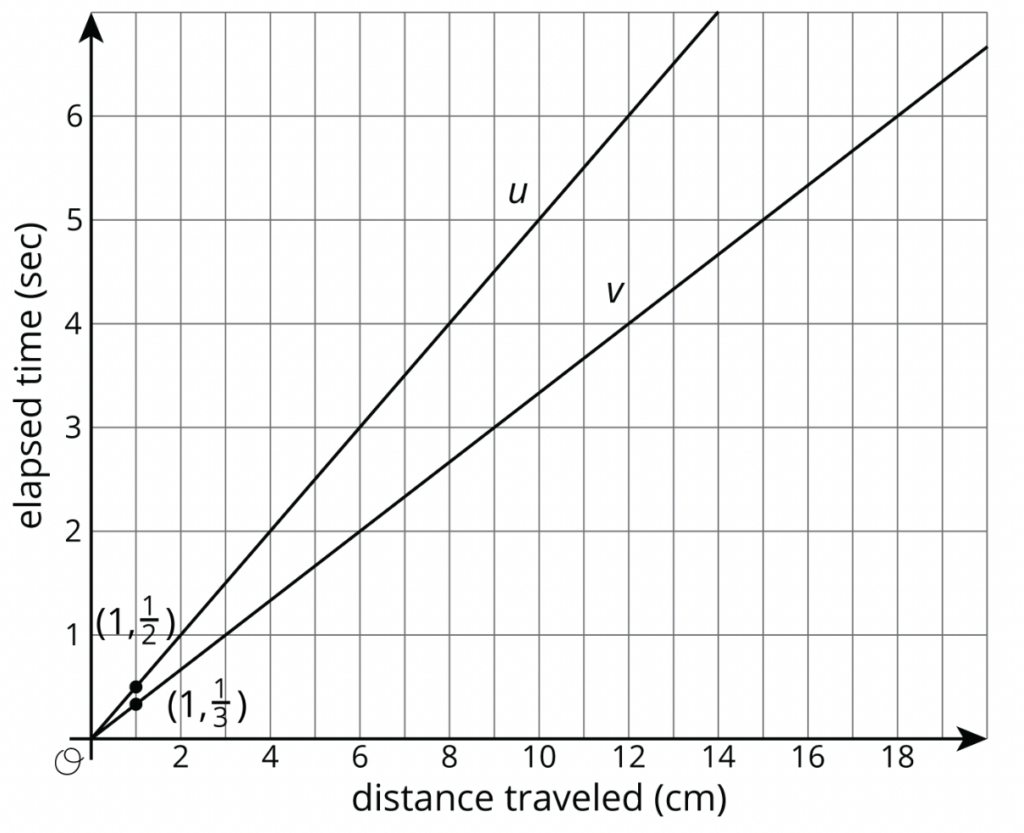
To help students make the connections between rate of change, slope, and the constant of proportionality, let’s return to contexts and start from the more familiar proportional relationships. The unit starts by having students attend to precision while they label axes, choose appropriate axes scales, and compare proportional relationships, such as the ladybug and ant who start at the same time but move at different paces, as shown here.
(https://curriculum.illustrativemathematics.org/MS/teachers/3/3/1/index.html)
In grade 7, students connected the constant of proportionality to the steepness of a graph of a proportional relationship. Now, they change focus from the constant of proportionality to rate of change, which is about how the output changes at a constant rate with respect to the input. They also practice identifying the rate of change in graphs, tables, equations, and contexts for different proportional relationships.
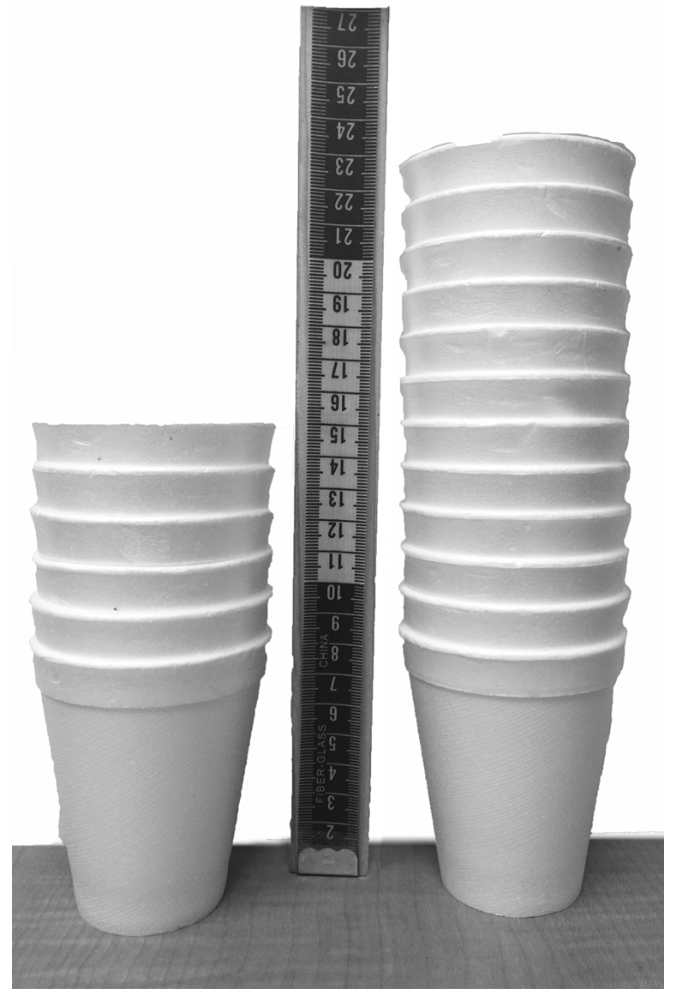
To help students take the next step toward working with non-proportional linear relationships in the second section of the unit, they begin by stacking cups.
(https://curriculum.illustrativemathematics.org/MS/teachers/3/3/5/index.html)
Stacking cups has two variables for students to keep track of: number of cups and height of the stack. The context is meant to be straightforward so students can switch fluidly between the concrete situation and the abstract calculation for the rate of change and connect the two. Here the rate of change has a tangible meaning: add 1 cup to the stack, increase the height of the stack by a fixed amount. Add 2 cups, increase the height by double that fixed amount. Plotting the pairs of (number of cups in the stack, height in centimeters of the stack) results in a set of points that a single straight line can go through. The connection between the slope of the line, the rate of change, and the context is made. At the heart of Unit 3 is establishing that non-proportional linear relationships exist, that they can be graphed as a line with an associated slope, that they have a rate of change just like proportional relationships from grades 6 and 7, and that the value of the slope is the same as the value of the rate of change.
This last point is something remarkable. A connection between the quotients of sides of triangles and the change in output divided by the change in input. Whether students think geometrically to calculate the slope of a line or algebraically to calculate the rate of change, they will get the same value.
The next lessons offer a second way to approach linear relationships by expressing regularity in repeated calculations. Students start by connecting a set of graphs to their matching contexts while paying close attention to the meaning of the vertical intercept and the value of the slope (Lesson 6, Activity 2). Only after this thinking do students consider how adding identical objects one after the other to a water-filled cylinder with a known initial height could be represented with an equation. It’s here that the $y = mx + b$ form is introduced with $m$ as the rate of change and $b$ as the initial amount.
But let’s not forget where all this started: geometry. The third way students conceptualize linear relationships is through transformations. Calling back to Unit 1, any line in the plane can be considered a vertical translation of a line through the origin. This work happens through contexts, visually with graphs, and in thinking through the difference between equations $y = mx$ and $y = mx + b$.
Refining Thinking: Calculating Slope and Solutions to Linear Equations
Rounding out the unit, students take their first steps into working with contexts that have a negative rate of change, which in turn leads to refining how to calculate slope. They also consider what happens when one of the two variables does not vary while the other one can take any value, leading to vertical and horizontal lines. The final lessons of the unit continue the work of connecting contexts and their equations while purposefully thinking about what it means for a point to be a solution to an equation. This work builds a strong foundation for the next units on systems of equations, functions, and modeling scatter plots with lines of fit.
Next Steps
Unlocking the full range of linear relationships opens multiple avenues of study for the future, not least of which is that systems of equations in Unit 4 are far more interesting when you have more than just proportional relationships to consider. Where else can you see the work of this unit playing out? In particular, how does the work in Unit 3 making connections between multiple representations to reason about linear relationships set students up for success as they reason about linear functions in Unit 5?
