
By Sonja Twedt, IM Certified® Facilitator, IM 6-12 Writing Team Special Projects Course Assistant
“In the digital era, data is the new oil.” —Srini Vemula
I can’t think of many middle school students I know who are not active on social media. Our students are constantly interacting with data. The digital platforms that they use continuously bombard them with information. Never before has the need to create wise producers and consumers of data been more urgent! But how do we do this when our students’ schedules are already full of classes that they need to take during their middle school years?
Enter our data literacy superheroes, the 6–8 grade statistics and probability progression. As students interact with these units, they have opportunities to learn critical data literacy skills. Students move from interpreting representations of data in grade 6 to recognizing and producing representative samples of data in grade 7, to analyzing associations between data in grade 8. The skills and understandings our students take away from these units will serve them, not only in the classroom, but in their everyday lives as well.
Grade 6: Interpreting Representations
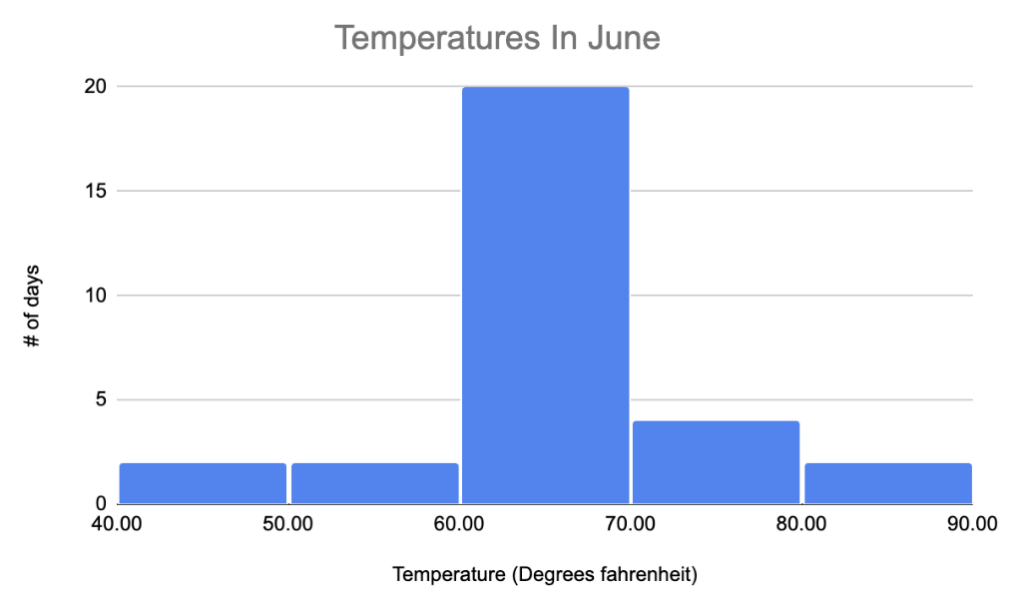
Consider the histogram below. Without an understanding of how to properly interpret it, a person may make the assumption that there are twenty 70 degree days in June. Consider the consequences if you were the owner of a waterpark making that interpretation while trying to decide whether to open in June, and you later found out that 18 of the days represented in the 60-69 degree bin were 60 degree days! Learning how to accurately interpret the representation of a set of data is a key skill in grade 6, and a skill that is clearly needed.
Students begin their study of data sets and distributions by collecting data and answering survey questions. They learn the difference between categorical and numerical data, and consider what makes a question a statistical question. Understanding that statistical questions can have variability in the answer helps students to understand the variability that is naturally present within data sets, priming them for considering what conclusions might be drawn from the data.
Students in grade 6 begin looking at the visual distribution of data through an introduction to histograms. They compare data shown in dot plots and frequency tables to histograms, considering what types of information are easier to glean from each graphical representation. For example, when looking at the graphs below, which graph makes it easier to answer the following two questions?
How many dogs have a weight of 90 pounds?
Do most dogs weigh more than 100 pounds or less than 100 pounds?
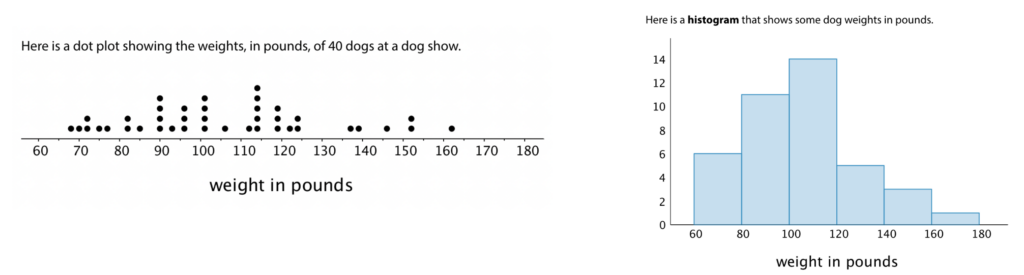
This work encourages students to consider which types of representations are most appropriate depending on the type of statistical questions being asked about the data.
As students move through the unit, they formalize their understanding of “center” and “spread.” The mean and median are introduced as measures used to summarize the center in a set of data, and the mean absolute deviation (MAD) and interquartile range (IQR) are explored as ways to summarize the spread of data anchored on the mean and median respectively. Variability in the data can make one measure of center more appropriate than another.
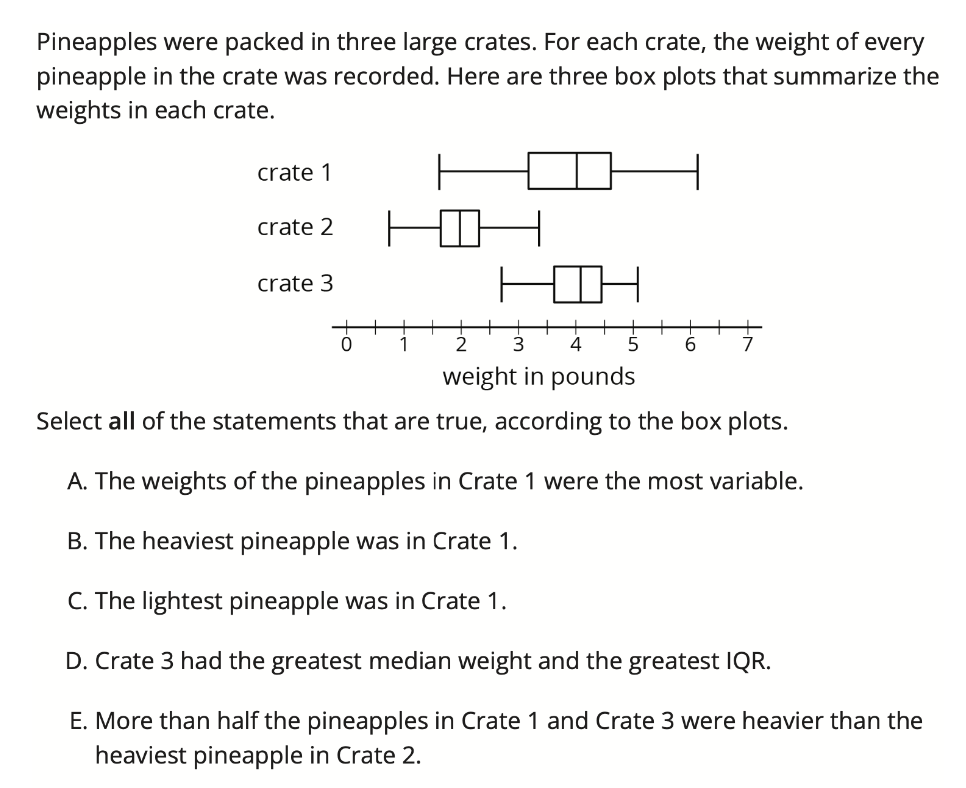
Finally, students learn how to create a box plot to represent the five number summary around the median. They use the box plot to make sense of data, compare distributions, and answer statistical questions. In the box plot shown below, from practice problem 3 in Lesson 17, students are asked to consider things like the variability in pineapple weight in each box, and which crates had the heaviest and lightest pineapples respectively.
Students walk away from grade 6 knowing how to ask good statistical questions and understand the different ways to represent and interpret the representations of univariate data. Recognizing when one representation may be more appropriate than another, what decisions can be made based on the representation of a data set, and how to critically analyze representations are valuable understandings as students become consumers of information in the world around them.
Grade 7: Producing Representative Samples
“None of the other teachers gave homework tonight!” was a common lament of my own children when they were teenagers. They were often stopped short when, upon being asked, they had to admit that “none” of the other teachers meant the “three” other teachers that their friends had, which I then pointed out was probably not very representative of all of the teachers in the school. As students have the opportunity to be data producers through the design of probability experiments in grade 7, they learn the importance of representative sample populations and the power that this gives them to generalize results as they make decisions based on their data.
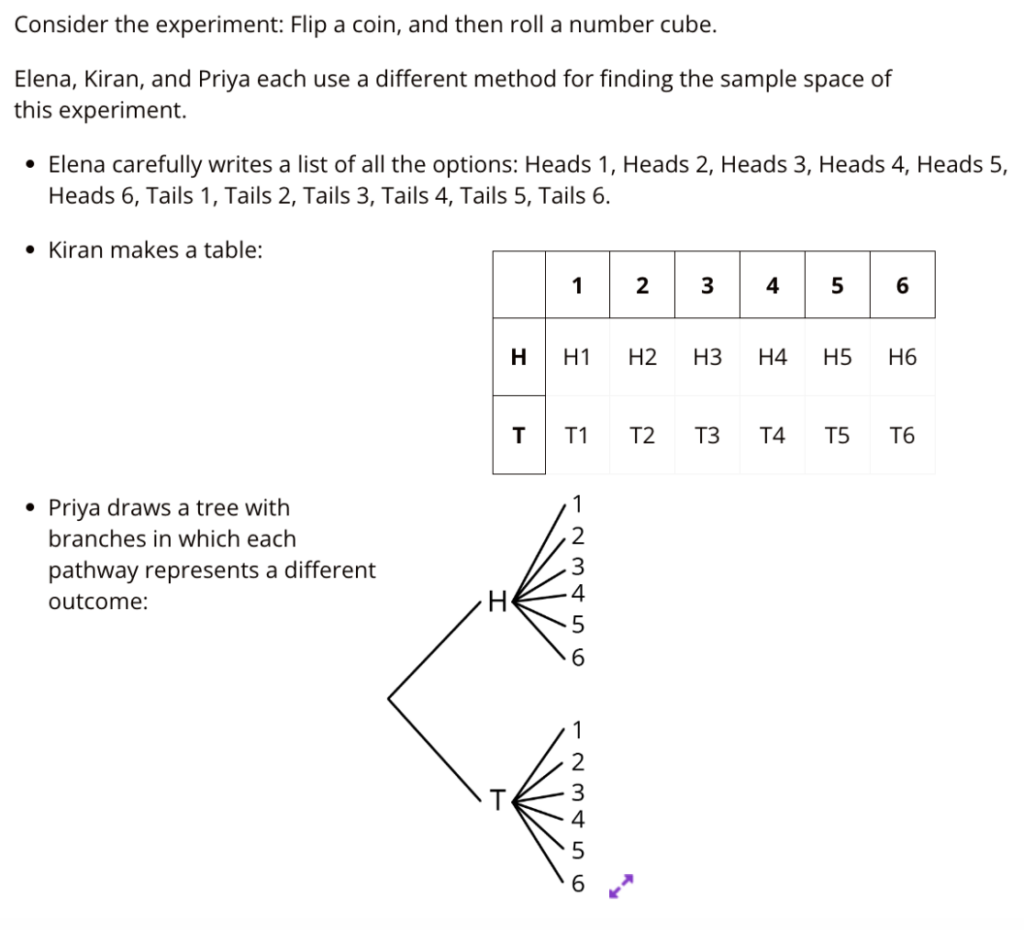
In the first half of this unit, students examine chance events and probability. Students collect data through repeated trials to make sense of its long run relative frequency. They learn how to create representations to keep track of the sample space of both single and compound events through lists, tables, and tree diagrams.
Students describe and create chance experiments that would fairly represent a situation, both for single and compound events.
In the second half of this unit, students consider what makes a representative and fair sample population, and examine when samples may have hidden bias. They are introduced to the idea that, if a sample is representative of the population, a statistical proportion can be used to represent the fraction of data belonging to a given category.
The work of grade 7 gives students the opportunity to consider how to collect data in a way that is both reliable and generalizable. They learn that proper data collection and analysis allows them to make predictions about values or populations they have not been able to test directly. These understandings, combined with those built in grade 6, lay the foundation for statistical work at grade 8.
Grade 8: Analyzing Associations In Data
“If I do my homework, will I really start getting better grades in my classes?”
Teenagers ask a lot of questions like the one above, wondering about if and how things are related. In grade 8, students build on what they’ve learned about creating and interpreting representations of data to consider questions about relationships between two varying phenomena in our world.
As students are introduced to bivariate data in grade 8, they begin producing and interpreting scatter plots, a new representation that can organize numerical data in two variables and gives a visual clue about whether two variables might be related to each other. For example, the scatter plot below begins to address the question of association between homework completion and class grades.
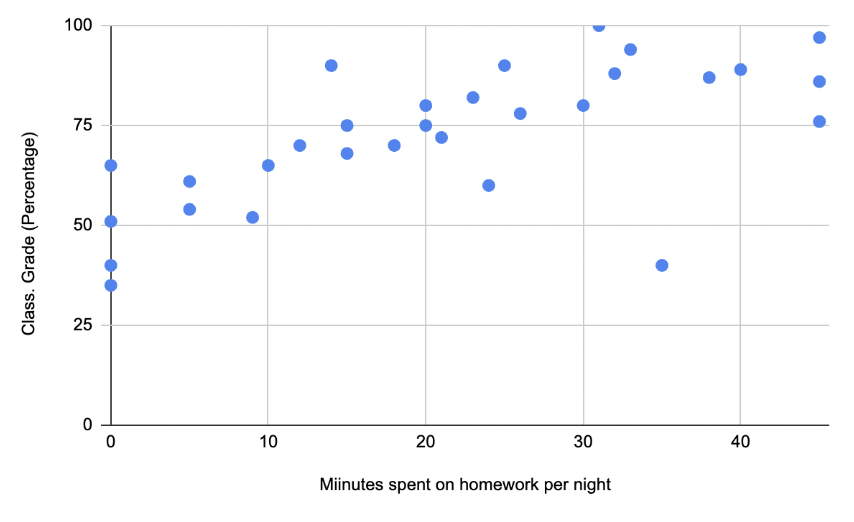
(image courtesy of Sonja Twedt)
As students continue to examine scatter plots in this unit, they use the concepts of center and spread introduced in grade 6, now expanding it to thinking around scatter plots, to make determinations about whether a set of data suggests a relationship between the two variables, and the strength of that relationship. They learn that the direction of the points will determine if the association between variables is positive or negative, and consider how to create a line of fit and write an equation to represent the association.
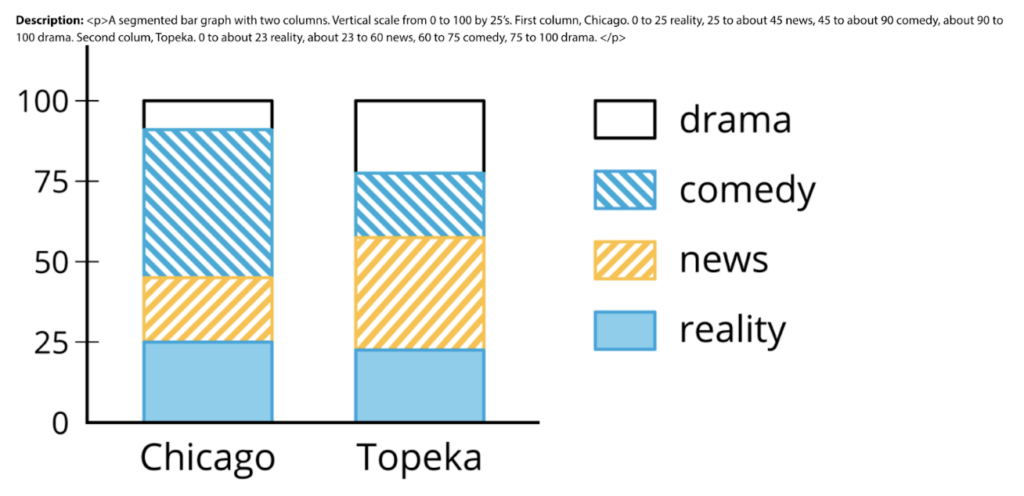
Categorical data is also considered in this unit, and is represented and analyzed through two-way tables, bar graphs, and segmented bar graphs. With categorical data, students analyze the relative frequencies of the data in order to determine whether there are associations between the data and what those associations are. Using these representations, they analyze sets of data for their associations, as in the practice problem below from Lesson 10 of Unit 6, which shows people’s TV viewing habits in two cities.
What a powerful set of tools and understandings for students to use as they continue to be curious about the world around them!
Next Steps
As we consider the grades 6–8 statistics and probability progression, let’s challenge ourselves to see its power beyond building a discrete set of skills. What do you understand now that might change the way you approach planning for and facilitating these units in your classroom? What connections can be made between and across grade levels? Let’s harness the power that these units have to build data literacy in our students!
